

Updated September 2026 · By Dr. Florian Smeritschnig, former McKinsey Senior Consultant
Market sizing questions ask you to estimate the size of a market, like the number of pizzas sold in the US each year, with no data and no calculator. You answer them in six steps: clarify, structure, assume, calculate, sanity-check, and interpret. Interviewers score that process, not the exact number.
Below are 25 market sizing questions with answers. Ten are fully worked examples, and wherever published data exists, the example ends by checking my estimate against it. You see how close a clean structure gets and what to do when it misses. The other 15 are practice questions with an answer key.
Since I left McKinsey in 2020, I have delivered 2,200+ mock interviews and coaching sessions. The candidates who bomb market sizing almost never fail at the arithmetic but they reach for a memorized framework instead of thinking, freeze when they have to invent an assumption, or hand over a number with no idea whether it is sane.
The important ingredient is simple: do not overthink it.
Key Takeaways
- Market sizing tests structured problem-solving, not math. A logical estimate in the right order of magnitude usually passes, because your reasoning is what gets scored.
- A repeatable 6-step method beats memorizing answers: clarify, structure, assume, calculate, sanity-check, and interpret.
- Five structures cover almost every question: top-down, bottom-up per customer, capacity, installed base divided by lifetime, and life-event flow. Picking the right one is half the skill.
- Firm matters: Bain runs dedicated sizing rounds, BCG mixes standalone and embedded sizing, and McKinsey almost never asks market sizing or estimation questions. It’s not how its interviews are conducted.
The 10 worked market sizing examples at a glance
| # | Market sizing question | Structure | Difficulty | My estimate | Reality check |
|---|---|---|---|---|---|
| 1 | How many pizzas are sold in the US each year? | Top-down | Easy | ~3.6 billion | ~1.8 billion from pizzerias alone |
| 2 | How many pizzas does one restaurant sell per year? | Capacity | Easy | ~24,000 | Plausible per-shift split |
| 3 | How many cups of coffee do US coffee shops sell per day? | Top-down + bottom-up | Medium | ~20 million | Two methods agree |
| 4 | How many weddings happen in Italy each year? | Life-event flow | Medium | ~220,000 | 173,272 (ISTAT, 2024) |
| 5 | How many new cars are sold in Germany each year? | Installed base ÷ lifetime | Medium | ~2.9 million | 2.82 million (KBA, 2024) |
| 6 | What is the annual revenue from charging EVs in Germany? | Bottom-up per unit | Medium | ~€1.4 billion | 1.65 million EVs (KBA) |
| 7 | How many fuel stations are there in Germany? | Supply from demand | Medium | ~11,000 | 14,018 (bft, 2025) |
| 8 | How many passengers fly through Heathrow each year? | Capacity | Hard | ~80 million | 83.9 million (Heathrow, 2024) |
| 9 | How much do US small businesses spend on project-management software? | B2B segmentation | Hard | ~$0.7 billion | Reverse check per firm |
| 10 | Should a grocer launch a private-label oat drink? | Sizing inside a case | Hard | ~€14 million revenue | The so-what |
What Are Market Sizing Questions?
Definition: A market sizing question (also called an estimation question or guesstimate) asks you to calculate the size of a market, in units or revenue, using logical assumptions instead of data. Consulting firms use it to test how you structure an ambiguous problem, make and defend assumptions, do mental math, and judge whether a result makes sense.
Typical prompts sound like “How many cups of coffee are sold in New York each day?” or “What is the annual market for running shoes in Brazil?” They show up on their own as a quick warm-up, or embedded inside a bigger case, like a market entry case where you first have to size the opportunity before recommending anything.
The skill is real consulting work. On live engagements, consultants constantly produce ballpark figures before any data arrives: the size of a new segment, the demand for a product that does not exist yet, the savings from a process change. Market sizing in the interview is a preview of that.
Does McKinsey, BCG, or Bain Ask Market Sizing Questions?
Yes and no, and the three firms use market sizing differently, which should shape how you prepare. This is based on what I have seen across hundreds of candidate debriefs.
- McKinsey does not ask standalone market sizing questions. It’s not part of how their interviews are conducted and constructed; the McKinsey case interview guide covers how their format flows. There can be outlier interviewers who ask a quick sizing question along the way. Out of all the McKinsey candidates I coached, only one received a market sizing case, in her final round.
- Bain often includes dedicated market sizing, especially in earlier rounds. If you are preparing for the Bain case interview, drill standalone estimation until it is automatic.
- BCG uses a mixed approach, with both standalone estimation questions and sizing embedded inside cases. The BCG case interview guide covers how their candidate-led format works.
Across all three, the evaluation criteria are the same: structure, sound assumptions, clean math, and a sane, interpreted answer. The firm only changes how often you see the question and whether it stands alone.
Why Interviewers Ask Market Sizing Questions
Interviewers use market sizing to watch how you handle ambiguity under pressure. There is no data, no obvious starting point, and no calculator. How you carve up that uncertainty tells them more than any answer could.
From the other side of the table, here is what I was actually scoring:
- Structuring. Can you break a vague problem into clean, logical pieces before touching numbers?
- Comfort with assumptions. Can you invent a reasonable figure, justify it in a sentence, and move on without spiraling?
- Mental math under pressure. Can you run a clean multiplication chain out loud without losing the thread? (The same skill is drilled in the case interview math guide.)
- Communication. Do you walk me through your logic, or go silent and surface a number I cannot follow?
- Business judgment. When you land on a result, do you know whether it is sane, and what it means?
Here is the honest verdict, especially if you have under four weeks to prepare: drilling one repeatable thinking process beats memorizing fifty practice answers. Most candidates do not fail market sizing because of math. They fail because they lack a clear thinking process.
How to Answer Market Sizing Questions: The 6-Step Method
This is the exact process I teach, and it is deliberately a process, not a template. A template tells you what boxes to fill in. A process teaches you how to think, so you can handle a question you have never seen. That is what firms test, and it is why memorizing “frameworks” lets so many candidates down.
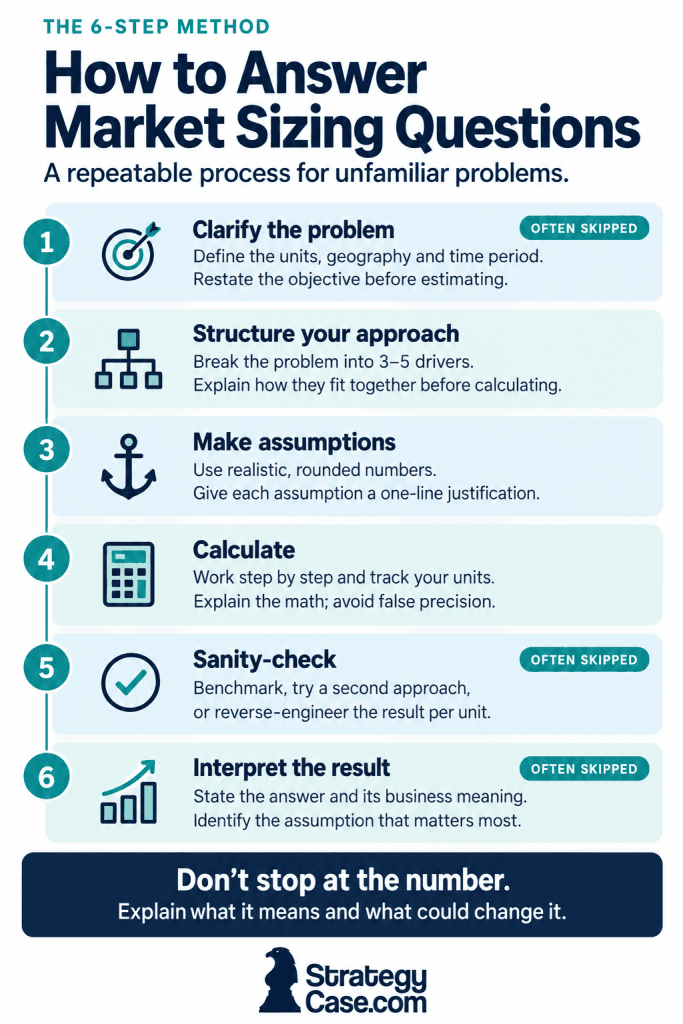
Step 1: Clarify the Problem
Before you estimate anything, define what you are estimating. Units or revenue? Which geography? What time period, a year or a day? A “market” can mean wildly different numbers depending on these.
Restate the objective back to the interviewer in one sentence: “So we want the annual revenue, in euros, from charging electric cars in Germany, at home and in public. Is that right?” Thirty seconds here saves you from solving the wrong problem perfectly.
Step 2: Structure Your Approach
Pick a structure (the five options are in the next section), then break the problem into three to five drivers and lay out how they multiply together. Communicate that structure before you calculate.
Say it out loud: “I will estimate the number of electric cars in Germany, how far each one drives per year, the energy that takes, and the price per kWh.” Now the interviewer can redirect you early if your logic is off, instead of watching you grind to a wrong answer.
Step 3: Make Assumptions
Use realistic, simple assumptions grounded in common sense, and state each one as you go. Round aggressively: 10%, 25%, 50% are far easier to work with than 12.7%. Some information might be provided by the interviewer upon request (for example, population numbers for smaller, less well-known countries). However, avoid asking about numbers you should know, like the population of your home country.
Anchor every assumption in something real: a benchmark you know, your own behavior, or basic logic. “I am driving around 500 km per month and charge my EV once during that period. I believe this is a relatively accurate number for mostly urban EV drivers. There are outliers on both sides, but let’s run with it for now.” Never pull a number from thin air without a one-line justification.
Step 4: Calculate
Work step by step and keep the math clean. Simplify numbers, strip trailing zeros before multiplying, and say each calculation aloud so the interviewer can follow.
Do not chase false precision. In a market sizing question, 8.1 billion and 8 billion are the same answer. Spending 40 seconds to turn 8 into 8.1 signals that you have missed the point.
Step 5: Sanity-Check
Before you present, ask whether the result is believable. There are three ways to do it, and the worked examples below use all three:
- Compare against a benchmark you know (a published figure, a company you know, your own spending).
- Triangulate with a second structure. If top-down and bottom-up land close, you can trust the number.
- Reverse-engineer it per unit. If your answer implies every German charges their car twice a day, something is wrong.
A number you have not sanity-checked is a liability.
Step 6: Interpret the Result
State your answer clearly, then say what it means. A raw number is not a recommendation. “Charging electric cars in Germany is worth roughly €1.5 billion a year. That is large enough to be interesting, and the key sensitivity is EV adoption: if the electric share of cars triples, so does the market.”
Most candidates stop at step 4 or 5. Interpreting the result is where you show the business judgment that gets offers, and it is the step I see skipped most often.
Top-Down, Bottom-Up, and 3 More Ways to Structure a Market Sizing Answer
Top-down and bottom-up get all the attention. In practice, five structures cover almost every market sizing question you will get, and choosing the right one decides whether your assumptions are defensible.
| Structure | Formula | Use it when | Worked example |
|---|---|---|---|
| Top-down | Population × % target × usage × price | Consumer markets with a clean starting population | #1 pizzas in the US, #3 coffee |
| Bottom-up per customer or unit | Number of units × usage per unit × price | The base unit (a car, a seat, a customer) is easier to picture than the population | #6 EV charging, #9 B2B software |
| Capacity (supply side) | Capacity per unit × units × utilization | Output is limited by a bottleneck: a cook, a runway, a machine | #2 one restaurant, #8 Heathrow |
| Installed base ÷ lifetime | Units in use ÷ years each lasts (+ growth) | Durable goods in mature markets: cars, fridges, phones | #5 new cars in Germany |
| Life-event flow | Population × share affected ÷ years per lifetime | Once-in-a-lifetime purchases: weddings, births, first homes | #4 weddings in Italy |
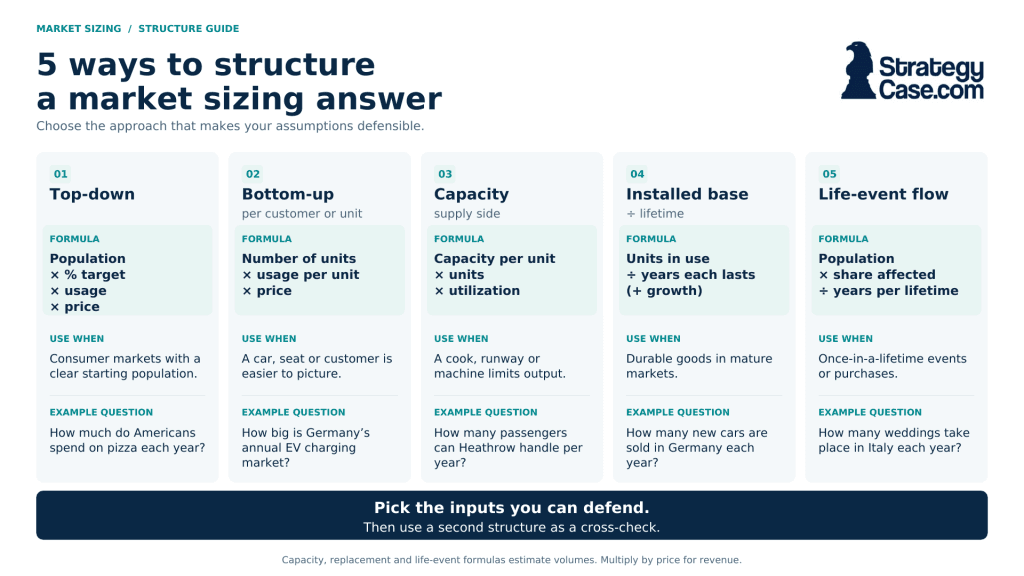
Watch how the same product can need two different structures. “How many pizzas are sold in the US?” is a clean top-down question. “How many pizzas does one restaurant sell?” is not: you would be guessing a restaurant’s share of a national market you have just invented. Start from the cook instead. Two very similar prompts need completely different approaches to lead to plausible outcomes, so keep that in mind whenever a question seems familiar.
When in doubt, name both: “I will go top-down from population, but I could cross-check bottom-up from the number of pizzerias.” That signals exactly the flexible thinking firms want, instead of the rigid template they do not.
10 Market Sizing Examples With Worked Answers
Each example runs the full 6-step method. Try the question yourself first, then compare. Where published data exists, the sanity check uses it, so you can see how far off a well-built estimate typically lands.
Example 1: How Many Pizzas Are Sold in the US Each Year? (Easy, Top-Down)
Clarify: Number of pizzas (units, not slices) sold in the US in a typical year, across dine-in, delivery, takeout, and frozen.
Structure: US population → share who eat pizza → pizzas per person per year. Top-down, because population is a clean starting point.
Assume and calculate:
- US population ≈ 340 million
- Share who eat pizza ≈ 90% → ≈ 300 million pizza eaters
- Pizzas per person per month ≈ 1 → 12 per year
- 300 million × 12 = 3.6 billion pizzas per year
Sanity-check: Example 2 gives you the cross-check. PMQ’s 2026 Pizza Power Report, citing IBISWorld, counts 75,736 US pizzerias. At roughly 24,000 pizzas each, that is about 1.8 billion pizzas from pizzerias alone, before frozen supermarket pizza and pizza sold by restaurants that are not pizzerias. So 3.6 billion is the right order of magnitude, if anything slightly high.
Interpret: “Around 3 billion pizzas a year is a huge, mature market. For a new entrant, the question is not total size but which segment, frozen, delivery, or premium, is growing fastest.”
Common slip: Starting with households instead of people and then multiplying by household size twice.
Example 2: How Many Pizzas Does One Restaurant Sell Per Year? (Easy, Capacity)
This one suits a real bottom-up, capacity-driven build. Instead of starting with demand, start with the production bottleneck: the cook. Looking at it from a population-based approach would lead to assumptions you cannot defend.
Clarify: Annual number of pizzas sold by one typical pizza restaurant.
Structure: Cook capacity → operating hours → utilization → operating days.
Assume and calculate:
- A pizza cook can prepare and manage about 20 pizzas per hour during busy periods.
- The restaurant is open 10 hours per day.
- Not every hour runs at full capacity. Assume 40% average utilization, since lunch and dinner are busy but the afternoon is slow.
- 20 pizzas/hour × 10 hours × 40% = 80 pizzas per day
- Open 6 days a week, roughly 300 days a year: 80 × 300 = 24,000 pizzas per year
Sanity-check: 24,000 pizzas a year is about 2,000 a month, or 80 per operating day. For a small-to-medium pizzeria, that means maybe 30 to 40 pizzas at dinner, 20 to 25 at lunch, and the rest from takeaway and quieter periods. That feels plausible.
Interpret: “One pizza restaurant likely sells around 25,000 pizzas per year. The key assumption is kitchen utilization. At 30%, volume drops to around 18,000 pizzas. A very popular place at 60% reaches around 36,000. So the answer is less about theoretical cook capacity and more about how consistently demand fills that capacity.”
Common slip: Dividing the national market from Example 1 by a guessed number of restaurants. You get a number, but you cannot defend either input.
The capacity approach works in many cases. Before reading Example 8, try to estimate the number of passengers at London Heathrow in a given year the same way. Think about which capacity constraint is the key building block. Hint: runway capacity.
Example 3: How Many Cups of Coffee Do US Coffee Shops Sell Per Day? (Medium, Triangulation)
Clarify: Cups sold per day by coffee shops (chains and independents). Exclude coffee made at home, at the office, at gas stations, and at fast-food restaurants. This definition matters more than any assumption that follows.
Structure: Solve it twice. Top-down from coffee drinkers, then bottom-up from the number of shops, and compare.
Top-down:
- 340 million people × ~75% adults ≈ 255 million adults
- ~2 in 3 drink coffee ≈ 170 million drinkers
- ~2 cups per drinker per day ≈ 340 million cups
- ~1 in 15 cups bought at a coffee shop ≈ 23 million cups per day
Bottom-up:
- Assume ~40,000 coffee shops, about one per 8,500 people, or four in a town of 35,000
- ~500 cups per shop per day (about 40 an hour over a 12-hour day)
- 40,000 × 500 = 20 million cups per day
Sanity-check: Two independent structures land within 15% of each other. That is the strongest sanity check available when you have no published figure to hand.
Interpret: “About 20 million cups a day, or roughly $30 billion a year at a $4 average ticket. Growth comes from moving home cups into shops, not from new coffee drinkers, so the lever to test is the 1-in-15 share.”
Common slip: Skipping the clarify step and sizing all coffee. You end up 15 times too high and never notice.
Example 4: How Many Weddings Happen in Italy Each Year? (Medium, Life-Event Flow)
Clarify: Number of weddings (not people getting married) in Italy per year, civil and religious.
Structure: Population → share who marry in their lifetime → spread over a lifetime → divide by two people per wedding.
Assume and calculate:
- Italy’s population ≈ 59 million
- ~60% of people marry at some point
- Spread evenly over an ~80-year lifetime: 59 million × 60% ÷ 80 ≈ 440,000 people marrying per year
- Two people per wedding: ≈ 220,000 weddings per year
Sanity-check: ISTAT counted 173,272 weddings in Italy in 2024, down 5.9% on 2023. My estimate is about 27% high. The weak assumption is the 60%: fewer Italians marry than previous generations did. Say that out loud; an interviewer rewards you for knowing which assumption to revisit.
Interpret: “Roughly 175,000 to 220,000 weddings a year, and falling. A wedding-dress business should size on today’s flow, not on population. At ~175,000 weddings, with ~90% of brides buying a new dress for ~€1,500, that is a market of about €240 million.”
Common slip: Forgetting that a wedding involves two people, which doubles the answer.
Example 5: How Many New Cars Are Sold in Germany Each Year? (Medium, Installed Base ÷ Lifetime)
Clarify: New passenger cars registered in Germany per year, private and company cars.
Structure: In a mature market, almost all new-car demand is replacement. Cars on the road ÷ years each car lasts.
Assume and calculate:
- Germany’s population ≈ 84 million
- ~0.6 cars per person ≈ 50 million cars on the road
- A car lasts ~15 to 20 years; use 17
- 50 million ÷ 17 ≈ 2.9 million new cars per year
Sanity-check: The Kraftfahrt-Bundesamt reports 2,817,331 new passenger cars in 2024 and 49.3 million cars on the road on 1 January 2025. The estimate is within about 3%.
Interpret: “About 3 million new cars a year. The lever is the replacement cycle: if a weak economy makes people keep cars one year longer, demand drops by about 6% without a single customer leaving the market.”
Common slip: Sizing top-down from “people who want a car” and ignoring that nearly everyone who wants one already has one.
Example 6: What Is the Annual Revenue From Charging EVs in Germany? (Medium, Bottom-Up per Unit)
Clarify: Annual revenue, in euros, from charging battery-electric cars in Germany, at home and in public.
Structure: Number of EVs → kilometers per EV → energy per kilometer → price per kWh.
Assume and calculate:
- ~40 million households × ~1.2 cars ≈ 48 million cars
- ~3.5% battery-electric ≈ 1.7 million EVs
- Distance: urban drivers do about 500 km a month (6,000 km a year); commuters drive more. Blend to ~10,000 km per EV per year.
- Energy: ~18 kWh per 100 km ≈ 1,800 kWh, round to 2,000 kWh per EV per year
- 1.7 million × 2,000 kWh = 3.4 billion kWh
- Price: ~70% charged at home at ~€0.35, ~30% in public at ~€0.55 → blended ≈ €0.40 per kWh
- 3.4 billion × €0.40 ≈ €1.4 billion per year
Sanity-check: The EV base holds up: the same KBA release counted 1,651,643 battery-electric cars on 1 January 2025, 3.3% of all cars. Reverse-check per car: €1.4 billion ÷ 1.7 million ≈ €800 a year, or about €8 per 100 km. A petrol car burning 7 liters per 100 km costs more than that, which fits the usual pitch that EVs are cheaper to run.
Interpret: “Roughly €1.5 billion a year today. EV adoption is the driver: at 10% of cars instead of 3.5%, the market roughly triples to about €4 billion. Public charging is the smaller but higher-priced slice, so a charging operator cares about the public share as much as total EVs.”
Common slip: Assuming a full battery charge every few days. The per-car sanity check (€/year) catches it immediately.
Example 7: How Many Fuel Stations Are There in Germany? (Medium, Supply From Demand)
Clarify: Number of public fuel stations selling petrol and diesel in Germany.
Structure: Work backward from demand. Total fuel sold per year ÷ fuel one station sells per year.
Assume and calculate:
- ~48 million cars, ~95% combustion ≈ 45 million
- ~12,000 km per car per year × 7 liters per 100 km ≈ 840 liters per car
- 45 million × 840 liters ≈ 38 billion liters, round to 40 billion
- One station: ~250 fill-ups a day × 40 liters = 10,000 liters a day × 360 days ≈ 3.6 million liters a year
- 40 billion ÷ 3.6 million ≈ 11,000 stations
Sanity-check: The bft counted 14,018 road fuel stations in 2025. My estimate is about 21% low. Two reasons: I left out vans and trucks, which also buy fuel, and a rural station sells far less than my 250 fill-ups a day. Naming the gap and its likely cause is worth as many points as the number.
Interpret: “Around 11,000 to 14,000 stations. The lever is throughput per station. As the EV share rises, volume per station falls and marginal stations close. That is why the count keeps shrinking.”
Common slip: Trying to guess the number of stations per town. You end up extrapolating from the one town you know.
Example 8: How Many Passengers Fly Through Heathrow Each Year? (Hard, Capacity)
This is the exercise from Example 2. If you tried it, compare your structure first and your number second.
Clarify: Total passengers per year (arriving, departing, and connecting) at London Heathrow.
Structure: Heathrow is constrained by runways, not by demand. Runways → flights per hour → operating hours → passengers per flight.
Assume and calculate:
- 2 runways, one mainly for landings and one for take-offs
- One movement about every 90 seconds per runway ≈ 40 per hour
- Night restrictions: ~17.5 operating hours a day
- 2 × 40 × 17.5 × 365 ≈ 510,000 flights a year
- Seats per flight: a mix of short-haul jets (~180 seats) and long-haul wide-bodies (~300) → average ~200
- Load factor ~80% → 160 passengers per flight
- 510,000 × 160 ≈ 80 million passengers per year
Sanity-check: Heathrow reported a record 83.9 million passengers in 2024. It is legally capped at 480,000 air transport movements a year and recorded 473,902 in 2024, about 177 passengers per flight. My flight count is ~8% high and my passengers per flight ~10% low, so the two errors partly cancel. The answer lands within 5%.
Interpret: “About 80 million passengers a year, and the airport is already at its flight cap. Growth can only come from bigger planes and fuller flights, which is why the third-runway debate exists.”
Common slip: Starting from London’s population and air-travel frequency. Demand-side logic cannot see the runway cap, and the runway cap is the whole answer.
Example 9: How Much Do US Small Businesses Spend on Project-Management Software? (Hard, B2B Segmentation)
Clarify: Annual subscription revenue from US businesses with fewer than 100 employees, for tools like task boards and project trackers.
Structure: In B2B, size who actually buys. Workers at small firms → share doing project work → share whose firm pays for a tool → price per seat.
Assume and calculate:
- US workforce ≈ 165 million; ~1 in 3 work at firms under 100 employees ≈ 55 million
- ~40% do desk or project work that needs coordination ≈ 22 million
- ~25% of those are on a paid tool today ≈ 5.5 million paid seats
- ~$10 per seat per month = $120 a year
- 5.5 million × $120 ≈ $0.7 billion per year
Sanity-check: Reverse it per firm. Assuming roughly 6 million small businesses with employees, that is about $110 per firm per year on average. Most small firms pay nothing, while a 40-person agency might pay a few thousand dollars. An average near $100 fits that spread.
Interpret: “About $0.7 billion today, and the headroom is adoption, not price. If paid adoption doubles from 25% to 50%, the market doubles. A new entrant should size the segments that coordinate many projects, like agencies and construction, before the total.”
Common slip: Multiplying every small business, including solo freelancers, by a per-seat price. B2B answers live or die on segmentation.
Example 10: Should a German Grocer Launch a Private-Label Oat Drink? (Hard, Sizing Inside a Case)
At BCG, sizing often appears like this: as one step inside a bigger question. The prompt: a German supermarket chain with ~15% of the grocery market is considering a private-label oat drink. Is it worth it?
Clarify: The client needs its own potential revenue, not the size of the oat drink market. Confirm that before sizing anything.
Structure: Households → share buying plant-based drinks → volume → oat share → price → the client’s share → the private-label share within the client’s stores.
Assume and calculate:
- ~41 million German households
- ~15% buy plant-based drinks regularly ≈ 6 million households
- ~1 liter per week each ≈ 312 million liters a year
- Oat is ~60% of plant-based ≈ 190 million liters
- ~€1.50 per liter ≈ €280 million oat drink market
- The chain’s 15% share ≈ €42 million of oat drink sold in its stores
- A private label takes ~1/3 of its own category ≈ €14 million revenue
Sanity-check: Per buying household, €280 million ÷ 6 million ≈ €47 a year, a bit under €1 a week. For a regular weekly carton habit, that is plausible.
Interpret: “About €14 million in revenue, which is modest for a chain this size. At private-label margins, it is worth doing only if a co-packer can supply it without new investment. Next, I would compare the private-label margin with the margin on the branded product it would replace.” That last sentence moves the case forward, which is the point of sizing inside a case.
Common slip: Proudly presenting the €280 million market when the client asked about its own revenue. You sized the wrong thing.
15 Market Sizing Practice Questions With Answer Keys
Practice these out loud, ideally with a partner who pushes back on your assumptions. Pick your structure deliberately, run all six steps, then check the key. The ballparks come from the suggested structure, not from official data, so if your structure is sound and you land within the same order of magnitude, you did it right.
| # | Market sizing question | Level | Suggested structure | Ballpark answer |
|---|---|---|---|---|
| 1 | How many smartphones are sold in the US each year? | Easy | People × ownership ÷ replacement cycle: 340M × 85% ÷ 3 years | ~100 million |
| 2 | How many haircuts happen in the UK each month? | Easy | Population × share with paid cuts × cuts per month: 69M × 75% × 0.6 | ~30 million |
| 3 | How many movie-theater tickets are sold in the US each year? | Easy | Population × share who go × visits per year: 340M × 50% × 4 | ~700 million |
| 4 | How many diapers are used in Germany each year? | Easy | Births × years in diapers × diapers per day × 365: 700k × 2.5 × 5 × 365 | ~3 billion |
| 5 | How many pairs of running shoes are sold in Brazil each year? | Easy | Population × share who run or wear them × pairs per year: 215M × 20% × 1 | ~40 million |
| 6 | What is the annual revenue of UK gyms? | Medium | Adults × membership rate × monthly fee × 12: 55M × 15% × £35 × 12 | ~£3.5 billion |
| 7 | How many liters of beer are served at Oktoberfest? | Medium | Visits × share drinking × liters per drinker: 6.5M × 70% × 1.5 | ~7 million liters |
| 8 | How many dentists does the US need? | Medium | Visits demanded ÷ visits per dentist: 340M × 1.5 ÷ (8 a day × 230 days) | ~275,000 |
| 9 | What is the UK pet insurance market worth? | Medium | Dogs and cats × share insured × annual premium: 25M × 25% × £300 | ~£1.9 billion |
| 10 | How much do US companies spend on employee laptops each year? | Medium | Workers needing a laptop ÷ replacement cycle × price: 80M ÷ 4 × $1,000 | ~$20 billion |
| 11 | How many ride-hail trips happen in New York City per day? | Hard | People in the city × share riding × trips each: 10M × 3.5% × 2 | ~700,000 |
| 12 | How many hospital beds does a city of 1 million people need? | Hard | Admissions × average stay ÷ 365 ÷ occupancy: 1M × 0.2 × 6 ÷ 365 ÷ 85% | ~4,000 |
| 13 | What is the annual market for wind-turbine maintenance in Germany? | Hard | Turbines installed × service cost per turbine: 30,000 × €40,000 | ~€1.2 billion |
| 14 | How big is the US market for AI meeting-notes software? | Hard | Knowledge workers × adoption × monthly price × 12: 60M × 10% × $15 × 12 | ~$1 billion |
| 15 | How many home solar systems are installed in Australia each year? | Hard | Households without solar × yearly adoption rate: 10M × 2/3 × 4% | ~270,000 |
Market Sizing Cheat Sheet: Formulas and Numbers to Know
You do not need to memorize answers. You do need a handful of formulas and rough benchmarks so you are never stuck inventing a number from nothing. Memorize these, not exact statistics.
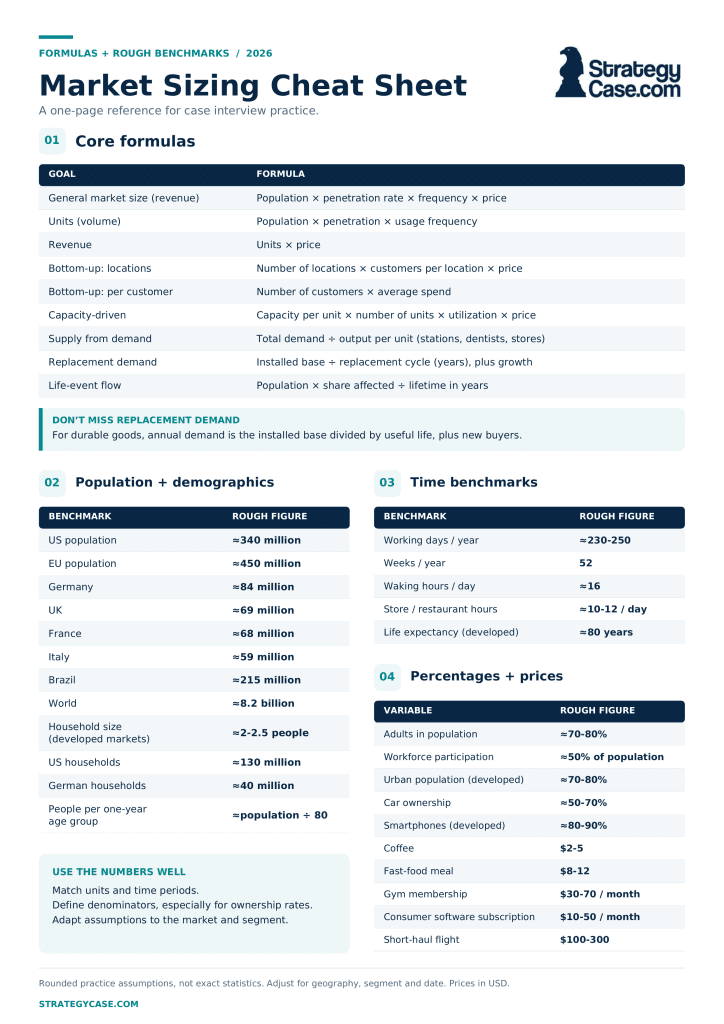
You can also download this market sizing cheat sheet here for free.
Core Formulas
| Goal | Formula |
|---|---|
| General market size | Population × penetration rate × frequency × price |
| Units (volume) | Population × penetration × usage frequency |
| Revenue | Units × price |
| Bottom-up (locations) | Number of locations × customers per location × price |
| Bottom-up (per customer) | Number of customers × average spend |
| Capacity-driven | Capacity per unit × number of units × utilization × price |
| Supply from demand | Total demand ÷ output per unit (stations, dentists, stores) |
| Replacement demand | Installed base ÷ replacement cycle (years), plus growth |
| Life-event flow | Population × share affected ÷ lifetime in years |
The replacement-rate formula is the one most candidates miss. For durable goods like cars, fridges, or phones, annual demand is mostly the installed base divided by how many years each lasts, plus new buyers.
Population and Demographic Benchmarks
| Benchmark | Rough figure |
|---|---|
| US population | ~340 million (US Census) |
| EU population | ~450 million (Eurostat) |
| Germany | ~84 million |
| UK | ~69 million |
| France | ~68 million |
| Italy | ~59 million |
| Brazil | ~215 million |
| World | ~8.2 billion |
| Average household size (developed markets) | ~2 to 2.5 people |
| US households | ~130 million |
| German households | ~40 million |
| People per one-year age group | ~population ÷ 80 |
Time Benchmarks
| Benchmark | Rough figure |
|---|---|
| Working days per year | ~230 to 250 |
| Weeks per year | 52 |
| Waking hours per day | ~16 |
| Typical store or restaurant opening hours | ~10 to 12 per day |
| Life expectancy (developed markets) | ~80 years |
Common Percentages and Pricing Heuristics
| Variable | Rough figure |
|---|---|
| Adults in population | ~70 to 80% |
| Workforce participation | ~50% of population |
| Urban population (developed) | ~70 to 80% |
| Car ownership | ~50 to 70% |
| Smartphone penetration (developed) | ~80 to 90% |
| Coffee | $2 to 5 |
| Fast-food meal | $8 to 12 |
| Gym membership | $30 to 70 / month |
| Consumer software subscription | $10 to 50 / month |
| Short-haul flight | $100 to 300 |
5 Mistakes That Sink Market Sizing Answers
After hundreds of market sizing mock interviews, the same five errors come up again and again. Each one is preventable.
- Memorizing frameworks instead of thinking. Candidates who drill a rigid template freeze the moment a question does not fit it. The 6-step method is a process precisely so it bends to any question.
- Picking the wrong structure. Sizing one restaurant top-down or Heathrow from demand produces numbers you cannot defend. Ask which input you can picture most clearly, then build from there.
- Overcomplicating the math. Chasing precision with ugly numbers wastes time and invites errors. Round hard and move.
- Unrealistic assumptions. Numbers disconnected from real behavior, like assuming every person buys five cars a year. Anchor each assumption in something you actually know or can defend.
- Poor communication. Going silent, then surfacing a number the interviewer cannot follow. Narrate every step.
The thread connecting all five: market sizing is a thinking exercise, not a math test. Fix the thinking and the math falls into place.
How to Practice Market Sizing Questions
Build a daily estimation habit. Size something real on your commute: how many flat whites this café sells before noon, how many buses run this route in a day. The reps train the instinct far better than reading more articles does.
When you practice, focus on the parts that actually get scored:
- Structure first, always. Say your approach out loud before any math.
- Rotate structures. Do at least one capacity and one installed-base question per week, not only top-down.
- Round aggressively and keep the arithmetic clean. The free case interview math drill generator builds the multiplication speed you need.
- Check against reality. When published data exists, look it up afterward and ask which assumption caused the gap.
- End with a so-what. Never stop at the number.
If you want structured drills with feedback, market sizing sits inside the broader skill set covered in the StrategyCase Case Interview Academy: case structuring, exhibit interpretation, and case math, with video lessons and practice drills. It builds the process this guide describes, then makes you run it under pressure until it is automatic.
Frequently Asked Questions
Does McKinsey ask market sizing questions?
Almost never. McKinsey’s interviewer-led cases are not built around estimation, and out of all the McKinsey candidates I coached, only one received a market sizing case, in her final round. An occasional interviewer may ask for a quick estimate along the way, so keep the skill warm, but do not make it a McKinsey priority.
Does BCG ask market sizing questions?
Yes. BCG uses a mixed approach: some interviewers ask standalone estimation questions, and others embed sizing inside a case, like Example 10 above. Bain asks dedicated market sizing questions most often, especially in earlier rounds.
How accurate does my market sizing answer need to be?
Accuracy matters far less than your approach. A logical estimate in the right order of magnitude (under 10x off) is generally fine, and landing within about 25% of reality is excellent. The worked examples above miss published figures by 3 to 27%, and each of those answers would pass.
How long should a market sizing answer take?
Plan for roughly five to ten minutes for a standalone question, including clarifying, structuring, and a short interpretation. When sizing is one step inside a bigger case, aim for two to three minutes and a rounder number, because the interviewer wants to get back to the main question.
What is the difference between a market sizing question, a guesstimate, and a brainteaser?
Market sizing questions, estimation questions, and guesstimates are the same exercise under different names: estimate a quantity with structured assumptions. A brainteaser is different. It usually has one correct answer or a trick, and it tests lateral thinking rather than business structure. See how to approach brainteasers in consulting interviews for that format.
Do I need to memorize population data for market sizing?
No. Memorize a small set of round benchmarks, major populations, average household sizes, common percentages, and rough prices, not exact statistics. The cheat sheet above is enough for almost any question, and interviewers will often give you less familiar numbers on request.
Final Thoughts
Market sizing is not about memorizing frameworks or finding the “right” number. It is about building a reliable thinking process you can run under pressure, on any question, including one you have never seen.
If you take three things from this guide, make them these:
- Skill beats frameworks. A flexible process beats a rigid template every time.
- Repetition beats theory. Reps build the instinct; reading does not.
- Clarity beats accuracy. A clear, well-communicated estimate beats a precise number no one can follow.
Work through the 10 examples, then the 15 practice market sizing questions, until the six steps run without thinking. For the full system (frameworks, math, charts, structuring, and firm-specific prep), start with StrategyCase’s free complete guide to consulting case interviews.
Related Guides
Keep sharpening the skills that surround market sizing questions:
- Case Interview Frameworks: how to structure any case, not just sizing
- How to Be MECE in a Case Interview: the structuring principle that keeps your buckets clean
- Brainstorming in a Case Interview: the idea-generation skill that pairs with structured estimation
- Profitability Case Interview: another core case type where sizing often appears
- Case Interview Examples: full worked cases from McKinsey and other top firms
Dr. Florian Smeritschnig is the founder of StrategyCase.com and a former McKinsey Senior Consultant who evaluated candidates for the firm. Since 2020 he has delivered 2,200+ mock interviews and coaching sessions, and his clients have secured 700+ consulting offers, 340 of them at McKinsey, BCG, and Bain. He is the author of three books on consulting interviews and careers, including The 1%: Conquer Your Consulting Case Interview. Last updated September 24, 2026.
