
Last Updated on May 7, 2026
The McKinsey Red Rock Game is a 35-minute digital assessment that tests how you collect, filter, and analyze data under time pressure. It replaced the old Problem Solving Test and now sits as the first game in McKinsey’s Solve suite. Most candidates fail it because they treat it like a trivia quiz instead of a disciplined research task.
We’ve coached 9,000+ candidates through the McKinsey Solve since 2019, and the Red Rock Study is the single piece of the assessment people underestimate the most. It looks simple at first click. Then the timer starts, the interface lags, and the calculations compound. That’s where most candidates lose the game.
This guide is what I’d give a coaching client today: what Red Rock actually tests, how the Study and Case sections work, and the 10 things that separate passing candidates from the rest.
Key Takeaways
- Red Rock is the first game in McKinsey Solve, a 35-minute research simulation with a Study section (three stages) and six mini-cases
- The clock runs across both sections, so pacing is the number one reason candidates fail
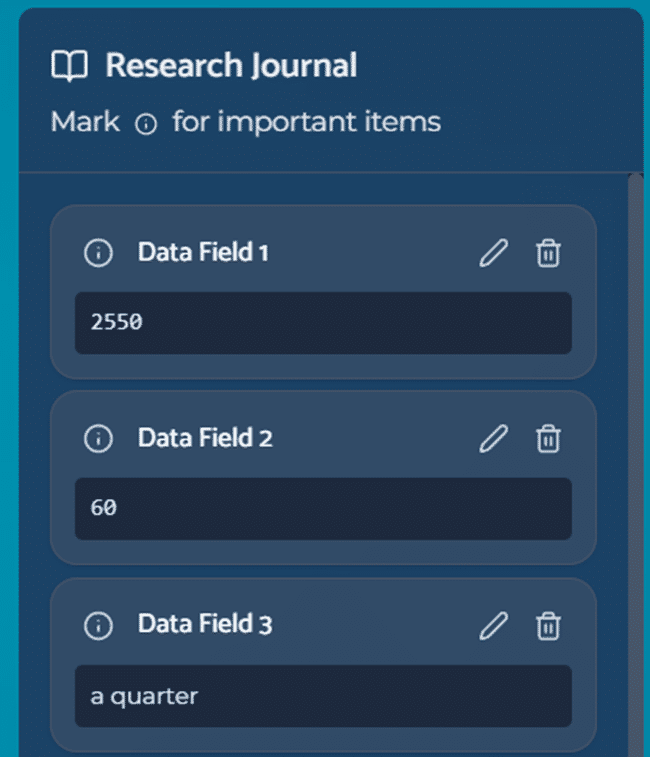
- The Study section tests investigation, analysis, and report writing with a drag-and-drop Research Journal
- Mini-cases test rapid quantitative reasoning, with charts or tables for each question
- No business background is needed, but GMAT-style numerical fluency helps more than memorized case frameworks
What Is the McKinsey Red Rock Study?
The Red Rock Study is a research-based simulation inside the McKinsey Solve. You play the role of a field researcher analyzing an animal population, usually in a desert or marine ecosystem. Your job is to investigate a scenario, run calculations, and write a short research report.
It’s the modern replacement for the Problem Solving Test (PST). Same cognitive bar. Different packaging. McKinsey moved away from business cases in the assessment to stop rewarding candidates who had memorized business terms and profitability trees. The Red Rock scenarios are designed so that a pre-med from Singapore and an MBA from Wharton start on the same footing.
Here’s what it actually tests:
- Extracting relevant data from dense text, charts, and tables
- Structuring calculations from multiple data sources
- Interpreting trends, proportions, and anomalies under time pressure
- Translating numerical findings into written and visual conclusions
What it does not test: memorized business frameworks, industry knowledge, or case interview mechanics. If you’ve been grinding profitability cases thinking that’s prep for Red Rock, you’ve been preparing for the wrong game.
How Red Rock Fits Into the McKinsey Solve
Since April 2026, McKinsey has standardized the Solve sequence globally. Red Rock comes first. Here’s the running order:
1. Red Rock Game, research simulation + six mini-cases (35 minutes)
2. Sea Wolf Game, pattern recognition and optimization in 3 scenarios (30 minutes)
3. Sustainable Future Lab, behavioral and situational judgement (20 minutes)
You’ll face all three in the curret McKinsey recruiting context. If you’re preparing for the full assessment, pair this guide with the Sea Wolf Game guide, the Sustainable Future Lab guide, and the broader McKinsey Solve assessment preparation article.
Red Rock itself rolled out in phases starting in late summer 2022, went broad in 2023, and has been the default opening game since 2024.
The Red Rock Study Section: Three Stages
The Study section is one scenario split into three sequential stages. You can navigate between them, but the design rewards finishing each stage cleanly before moving on.
Stage 1: Investigation
You’re dropped into a scenario with a research question, for example: estimate the population change of a rodent species between two years. The center panel shows text excerpts, charts, and tables. Some of it matters. Most of it doesn’t.
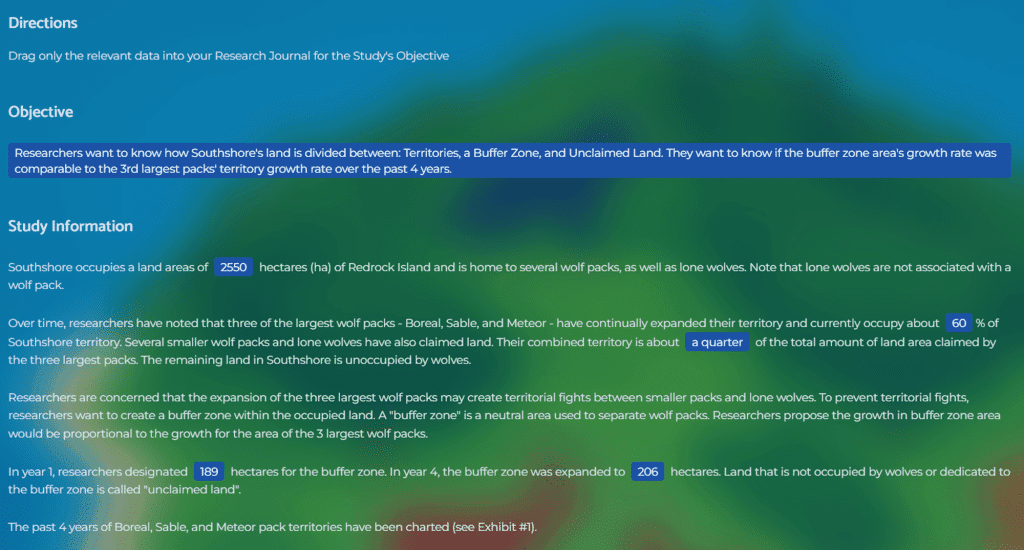
Your job is to drag relevant evidence into the Research Journal on the right side of the screen.
This stage fails candidates in two ways:
- Over-collecting: grabbing every chart and sentence “just in case.” The Journal becomes unusable by the time you reach Analysis.
- Under-filtering: reading too broadly without asking “does this help answer the objective?” for each data point.

The disciplined approach: read the research objective twice before touching anything. Then treat each data element as a yes-or-no decision. Collect the yes. Ignore the no. Move on.
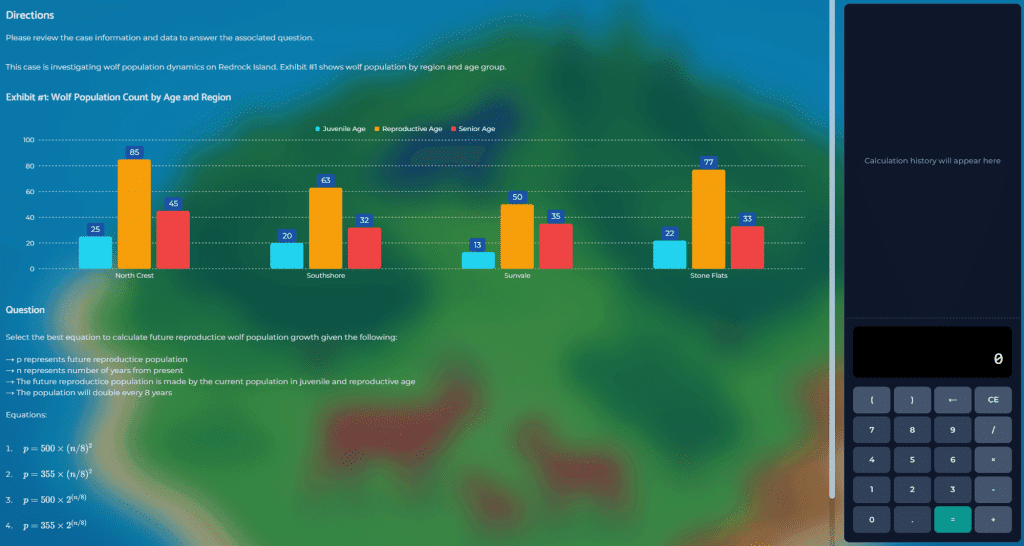
Stage 2: Analysis
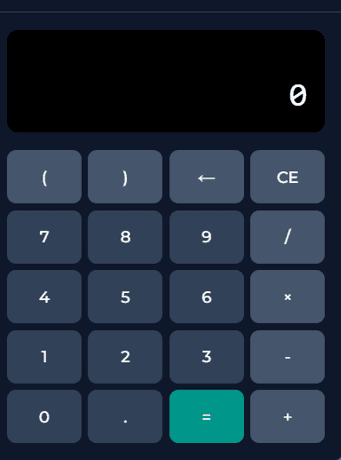
Once you enter Analysis, you’ll see three to five quantitative questions. The on-screen calculator lets you drag data directly from your Research Journal into the formula. Accurate. Slow. Occasionally buggy.
Two things trip people up here:
- Technical friction: the drag-and-drop registers inconsistently, especially on older machines. Clicks that feel fast often don’t register.
- Setup errors: most wrong answers come from mismatched timeframes, unit confusion, or missing a data point, not arithmetic.
I’ve had coaching clients escalate technical issues to McKinsey and get either a second attempt or the Red Rock result excluded from evaluation. It’s rare but possible if the bug is severe and documented.
Practical rule: build the formula mentally before you touch the calculator. If you can’t state the equation in words, you’re not ready to compute it.
Stage 3: Report
The final stage asks you to write a short research report.
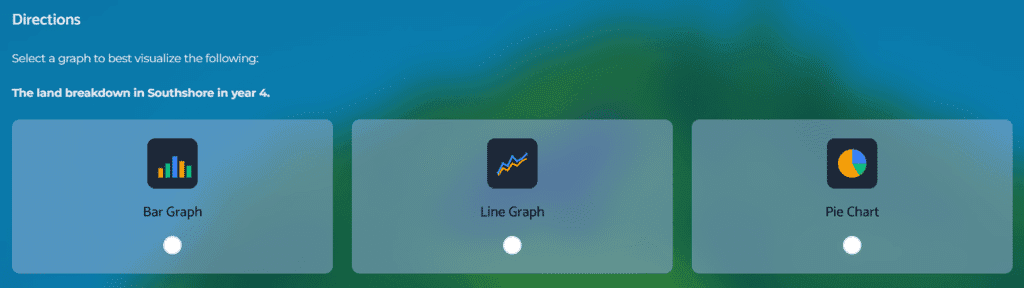
You get:
- A guided text template with predefined blanks to fill in your findings
- A chart-building tool where you pick the right visualization (line, bar, pie) and plug in the correct data points
The report stage rewards candidates who were disciplined in Investigation and Analysis. A clean, organized Research Journal makes this phase fast. A messy Journal turns it into a scavenger hunt.
| Game stage | Key challenges | Tips for success |
|---|---|---|
| Investigation | Identifying relevant data amidst distractions; managing a large volume of diverse information. | Focus on the objectives to filter relevant information; use the drag-and-drop feature to organize data effectively in the Research Journal. |
| Analysis | Performing calculations with a potentially buggy interface; deriving accurate conclusions from data. | Set up calculations and perform them with the in-game calculator; be prepared to troubleshoot or find workarounds for technical issues. |
| Report | Synthesizing findings into a coherent report; selecting the most effective visual data representation. | Select the right data and information for the research report; choose the the most suitable chart type and data to visualize your findings. |
The Red Rock Case Section: Six Mini-Cases
Introduced in early 2023, the Case section sits inside the same 35-minute Red Rock window. Six self-contained mini-cases, each with its own charts or tables, each asking a quantitative question.
Think GMAT data sufficiency, but drawn from research scenarios.
What makes the Case section hard isn’t any individual question. It’s the mode-switching. You finish deep analytical work in the Study section, then have to pivot to rapid-fire quantitative reasoning with no runway.
The time math is brutal. If the Study section takes you 25 minutes, you have 10 minutes for six mini-cases. That’s 100 seconds per question, including reading the chart, setting up the calculation, and entering the answer.
Most candidates who fail Red Rock fail here, not in the Study section. They over-invested time in the Study part and ran out of runway.
The Red Rock Interface

The screen is split into three panels:
Left panel (Navigation): moves you between Investigation, Analysis, Report, and the six mini-cases. You can jump between stages, but the interface discourages excessive back-and-forth.
Center panel (Data and Tools): displays task content. Text excerpts and charts during Investigation. Questions and calculator during Analysis. Report builder during Report.
Right panel (Research Journal): your evidence vault. Everything you drag in stays accessible across all stages. Flag important entries. Label them clearly. A tidy Journal is the single biggest time-saver in the assessment.
9 Tips to Pass the McKinsey Red Rock Game
These are the habits I see in candidates who pass the assessment, drawn from hundreds of post-assessment interviews since 2019.
1. Know That the Clock Runs Across Both Sections
The single most common mistake: treating the Study section and Case section as separate timers. They aren’t. The 35 minutes covers everything. Strong candidates finish the Study section between 20 and 25 minutes to preserve time for mini-cases.
2. Read the Objective Before You Read Anything Else
Every scenario starts with a specific research question. Read it twice. Rephrase it in your own words. Only then start scanning data. Candidates who skip this step end up collecting evidence that doesn’t feed the actual analysis.
3. Treat Every Data Point as a Yes-or-No Decision
Does this help answer the objective? Yes, drag it in. No, skip it. Speed comes from ruthless filtering, not fast reading.
4. Keep the Research Journal Ruthlessly Organized
Label entries with what they are, not where they came from. “2022 rodent population (survey A)” beats “Chart 3.” Flag the critical entries so you can find them fast in Analysis and Report.
5. Build the Formula Before You Touch the Calculator
Say the equation out loud. Confirm the inputs match the question’s units and timeframe. Then compute. This single habit eliminates 60% of the errors I see in post-game debriefs.
6. Watch the Units and Timeframes
Red Rock questions are written to punish sloppiness. A population in thousands versus individuals. A rate per year versus per decade. A proportion versus an absolute number. If you miss one of these, the math won’t save you.
7. Work Forward, Not Backward
Finish Investigation before entering Analysis. Finish Analysis before entering Report. Returning to earlier stages to fix mistakes costs more time than doing each stage carefully the first time.
8. Anticipate Interface Lag
The drag-and-drop doesn’t always register. Slow, deliberate movements beat rushed ones. If something doesn’t land, pause and reposition. Rushing creates rework.
9. Build Chart Fluency Before the Assessment
You’ll see line charts, stacked bars, pie charts, and proportional breakdowns. For every chart, identify axes, units, and timeframe before interpreting trends. If this isn’t automatic, drill it. Our article on data and chart interpretation covers exactly this pattern.
How to Prepare for the McKinsey Red Rock Game
Here’s the uncomfortable truth about Red Rock prep: most of what’s online is written by people who’ve never actually played the game. Generic advice like “practice your math” doesn’t help when the bottleneck is an understanding of the typical question patterns, the drag-and-drop interface and a misleading timer.
What actually works, in order of impact:
1. Simulation practice. You need to experience the interface, the drag-and-drop friction, the three-panel layout, and the pacing pressure before test day. Reading about it isn’t enough.
2. Structured process habits. Build the routine of objective first, filter second, compute third. Practice it until it’s reflex.
3. Familiarity with common question patterns. Growth rates between periods. Proportional changes across segments. Identifying the dominant driver in a trend. These recur across scenarios.
We cover all three in the McKinsey Solve Game Guide and Simulations, which include the Red Rock simulation, strategy guide, and a video walkthrough based on 600+ candidate debriefs and actual current gameplay experience.
FAQ
What skills does the McKinsey Red Rock Study test?
Data collection, data filtering, numerical reasoning, chart interpretation, structured calculation, and concise written synthesis. It does not test business knowledge, consulting frameworks, or memorized case types.
How is Red Rock different from the old McKinsey PST?
The PST used business scenarios. Red Rock uses research scenarios (animal populations, ecosystem studies). The cognitive demands are equivalent, but Red Rock doesn’t reward candidates who memorized business patterns. It isolates raw problem-solving ability.
Can I pass Red Rock without a business background?
Yes. That’s the point of the redesign. Candidates from medicine, engineering, natural sciences, and humanities pass at similar rates to MBA candidates. What matters is quantitative fluency and disciplined process, not industry knowledge.
How long is the Red Rock Game?
35 minutes total, covering both the Study section (Investigation, Analysis, Report) and the six mini-cases. The timer does not pause between sections.
What happens if the interface glitches during my assessment?
Document the issue immediately (screenshot if possible) and contact McKinsey’s technical support. In some cases candidates have received a retake or had the affected results excluded. This is not guaranteed, but it’s been granted when the bug is severe and well-documented.
How do I manage time if I get stuck?
Move on. The Red Rock scoring rewards completion across all six mini-cases more than perfection on one. If a question is eating more than 90 seconds, make your best judgment call and advance. You can’t afford to leave questions blank.
What’s the best way to prepare for Red Rock?
Three ingredients: numerical fluency (GMAT-style math), interface familiarity (simulations that replicate the actual game), and process discipline (objective-filter-compute routine). Generic case prep won’t help.
The Bottom Line
Red Rock isn’t a test of how smart you are. It’s a test of how disciplined you are under time pressure. Candidates who pass don’t have faster brains. They have cleaner processes and familiarity with the test design: read the objective, filter ruthlessly, organize the Journal, compute accurately, and pace across the full 35 minutes.
If you’re preparing for the McKinsey Solve, run simulations until the interface and question types feel routine.
The McKinsey Solve Game Guide and Simulations include the full Red Rock prep system: strategy guide, realistic simulations, and video walkthroughs based on 600+ candidate debriefs. Pass rate among customers was 89% in Q1 2026.
Updated April 2026 | By Florian Smeritschnig, Former McKinsey Senior Consultant

2 Responses
I did not manage to finish the last part of the red rock. ecosystem was fine. is it still okay to pass?
Hi, Yes I have worked with several candidates that did not finish all elements of the Solve game over the last couple of years, also the Red Rock part and passed. The overall answer is that it is hard to tell from the outside. It depends on several other factors like the performance in the rest of the game (how much time did you take to pass the ecosystem and are you sure it is correct, how much time did you take for the first part of the rr game and are you sure all answers are correct), your resume, the general hiring situation. Fingers crossed for a positive outcome! Florian